Hotel Website Conversion Rate Benchmarks: Where Does Your Property Stand?
What a good hotel website booking conversion rate actually is, why most published benchmarks for it are unverifiable, what is actually sourced, and how to check your own numbers in GA4.
I get asked some version of this question by almost every hotel owner I talk with about a new direct-booking website: what’s actually a good conversion rate? It’s worth researching properly, because the answer shapes a real decision. How much should you invest in a booking flow that’s easy enough to use that a guest not only books once, but comes back and books directly again next time? This page is a reference point. It covers what a normal conversion rate looks like for an independent hotel, resort, or vacation rental website, where the biggest gaps usually show up, and how to pull your own numbers in ten minutes.
A couple of tools come up later in this piece, so in plain terms:
GA4: Google's free website-analytics tool. It's how you see how many people visit your site, where they came from, and whether they actually book.
Google Hotel Ads: a Google feature that shows your hotel's live rates directly in Google Search and Maps, right next to OTA listings.
What conversion rate means for a hotel website
For a hotel website, conversion rate is simply the percentage of visitors who complete a booking through your booking engine (the tool on your site that actually takes the reservation and payment) out of everyone who visits. If 1,000 people land on your site in a month and 20 of them book, that’s a 2% conversion rate.
It’s a different number from your OTA conversion rate. OTAs (Booking.com, Expedia, and similar third-party sites that list your rooms alongside everyone else’s) convert meaningfully higher, because a visitor who has already searched, compared, and clicked into a specific listing is close to a decision.
You’ll see a specific OTA conversion figure, often “12-15%,” repeated across a lot of hotel-marketing content. I checked, and it doesn’t trace back to any identifiable public source, OTA disclosure, or research firm.
Every hotel-marketing article you’ll read states OTA conversion rate as fact. None of them can tell you where the number came from.
The closest real thing I found to that number is a commission rate, not a conversion rate: Booking.com raised its commission from 12% to 15% in several Australian markets (Sydney, Melbourne, Gold Coast). I can’t confirm that’s where the “12-15%” conversion-rate claim came from, but I also can’t find any Australian source that reports 12-15% as an actual conversion rate - it’s a plausible explanation for where the mix-up started, not a confirmed one.
OTA platforms do report real visitor-to-booking conversion data to regulators. It just isn’t made public. A 2016 monitoring exercise run by 11 EU national competition authorities and the European Commission has a section titled “OTA conversion rates (‘look-to-book’ ratios)” confirming exactly this.
OTAs supplied conversion-rate data for a representative sample of hotels in each participating country. Regulators used it to check whether conversion rates changed after parity-clause rules changed. (A parity clause is a contract term that stops a hotel from offering a lower price on its own website than on the OTA.) They found no evidence of a decrease. No specific percentage is published in the report itself. The data existed, went to the regulator, and the number never became public.
That’s about as close as this gets to independent confirmation that a real figure exists somewhere, and confirmation that it isn’t the “12-15%” quoted everywhere else.
One real, named data point I did find, for a different platform: Anna Samarkina, head of Yandex Travel’s affiliate program, is quoted citing an 8% average visit-to-booking conversion rate, reported by Forbes Russia and covered by AIM Group in 2023 - a secondary source quoting a named executive, not a direct company disclosure.
Russia’s OTA share of hotel bookings runs structurally lower than the US market this page is written for, so 8% isn’t a usable US benchmark either. I’m citing it for one narrow reason: it’s a real, attributed number showing OTA conversion landing well above typical direct-website conversion.
OTA traffic converts higher because it’s already closer to a decision. That part is real. The precise number everyone quotes for it is not.
Your own website carries more of that earlier-stage traffic, so a lower number here isn’t automatically a problem. The question isn’t “why don’t we convert like Booking.com,” it’s “are we converting like other direct-booking hotel websites.”
Benchmark ranges
Here’s the honest state of this data: I went looking for a real, primary source behind the “1.5-3.9%” range you’ll see repeated everywhere on this topic.
That search included Cloudbeds’ actual 2026 State of Independent Hotels Report - 90 million real bookings, tens of thousands of properties, 180 countries, as thorough an independent-hotel dataset as exists publicly. It doesn’t contain a website conversion-rate figure at all.
That’s not an oversight on Cloudbeds’ part. Cloudbeds is a PMS (property management system, the software that runs a hotel’s day-to-day bookings and operations). A PMS sees bookings arriving through a channel. It doesn’t see the visitors who left a hotel’s website without booking. Conversion rate (visits to bookings) isn’t something a PMS can measure in the first place. To get that number, you need your own website analytics instead.
If the largest independent-hotel dataset publicly available doesn’t track this number, be skeptical of anyone who states it with confidence.
So treat any specific percentage you see for this metric, on this page or anyone else’s, with real skepticism unless it’s tied to a named, checkable source:
- A widely-repeated range: 1.5% to 3.9%, with 2% often cited as a rough midpoint. I traced this back to Hotel Tech Report, whose own article states the number without citing where it comes from, so it’s a claim, not a verified benchmark. Useful as a rough sanity check, not something to treat as authoritative.
- High-performing boutique properties: 5% or higher is commonly cited as best-in-class, with the same caveat. I couldn’t find a primary study behind the specific figure.
- By traffic source: high-intent channels (Google Hotel Ads, metasearch, direct/branded traffic) convert meaningfully better than low-intent channels (blog, general organic, social) - this direction is well established even where the exact numbers aren’t. More on what’s actually verifiable at the channel level below.
The most useful number here isn’t a published average at all - it’s your own site’s number against its own history, which is what the “check your own numbers” section below walks through.
Benchmarks by individual channel
Most articles on this topic publish a table breaking conversion rate down by acquisition channel
- Google Hotel Ads at X%, organic search at Y%, email at Z%. I looked for a real, traceable source behind those tables and didn’t find one. The specific numbers vary from site to site with no shared citation - that’s the pattern you see when a number gets repeated enough times that it starts to look like data. I’m not adding another unsourced table to that pile.
What does hold up is Triptease’s platform data, tracked across more than 10,000 hotel websites - real aggregate behavior, not a survey:
- Undercutting your own direct rate on an OTA costs you conversion, measurably. When an OTA shows a lower price than your own website for the same room, your site’s conversion rate drops by around 30%. Guests check both, and a cheaper OTA price is a reason to book there instead.
- Rate parity recovers a meaningful share of that. Matching your OTA price on your own site is associated with roughly a 34% conversion lift for direct visitors.
- Having the outright best rate direct does more than parity alone. Triptease’s data shows this can roughly triple booking-engine conversion for a visitor who’s already comparing prices, since it removes their main reason to leave for an OTA.
This matters more than a channel-by-channel percentage table would, because it’s something you can actually act on regardless of your traffic mix: parity and messaging are within your control, where “what does Google Hotel Ads convert at” mostly isn’t.
A guest who books direct because your price and booking flow gave them a reason to is also the guest most likely to come back and book direct again next time, instead of defaulting to an OTA out of habit.
Mobile vs desktop
Mobile devices account for somewhere around 60-70% of hotel website traffic today, and that share keeps growing. Mobile converts meaningfully lower than desktop - that direction is well established.
I couldn’t find a credible, traceable percentage split to cite with confidence, for the same sourcing reason as the section above, so I’m not going to invent one here.
What is well documented is why the gap exists: the booking flow itself is often worse on a phone - more taps required, smaller touch targets, a date picker that’s awkward with a thumb, or a redirect to a third-party widget that looks nothing like the site the guest was just on.
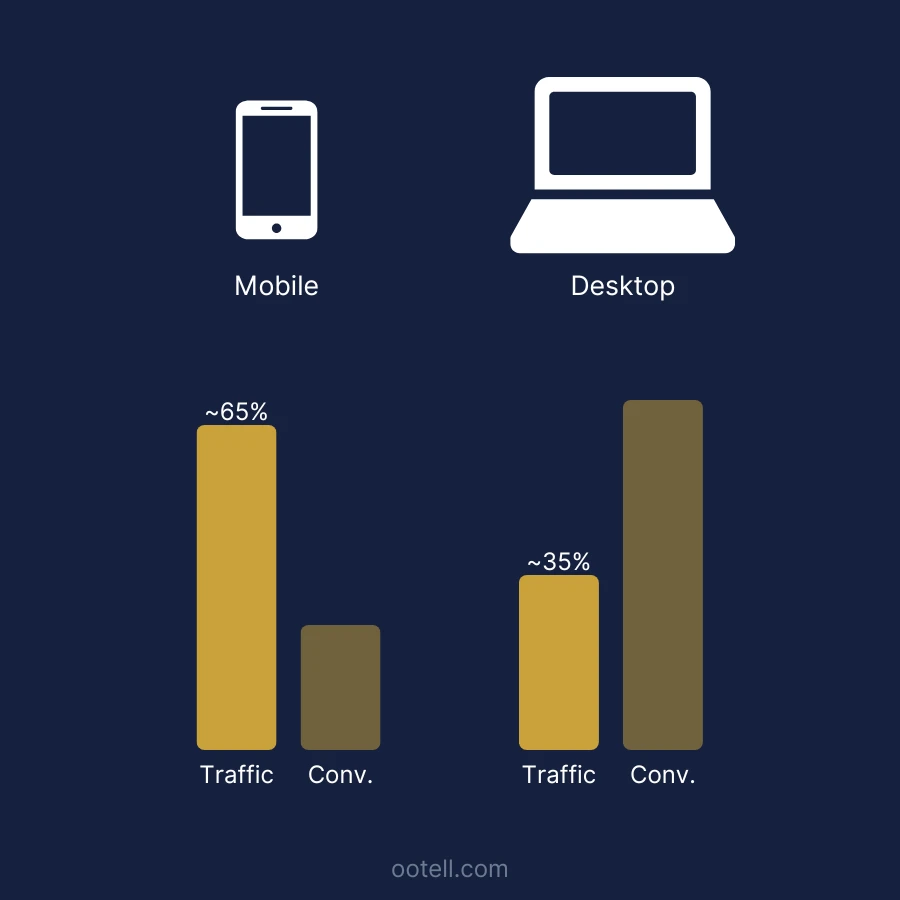
If your traffic is majority-mobile (check this in GA4 - see below) and your mobile conversion rate is meaningfully lower than desktop, that gap alone can be a bigger lever than trying to attract more traffic. I cover this in more detail in mobile booking best practices.
Why load time moves the needle
Page speed isn’t just an SEO checkbox - it has a direct, measured effect on whether a visitor sticks around long enough to book. Google’s own mobile research found that 53% of mobile visitors abandon a site that takes longer than 3 seconds to load, and that the probability of a visitor bouncing increases sharply as load time climbs past that point. Conversion rates follow the same pattern: each additional second of load time tends to cost a meaningful percentage of conversions, particularly on mobile.
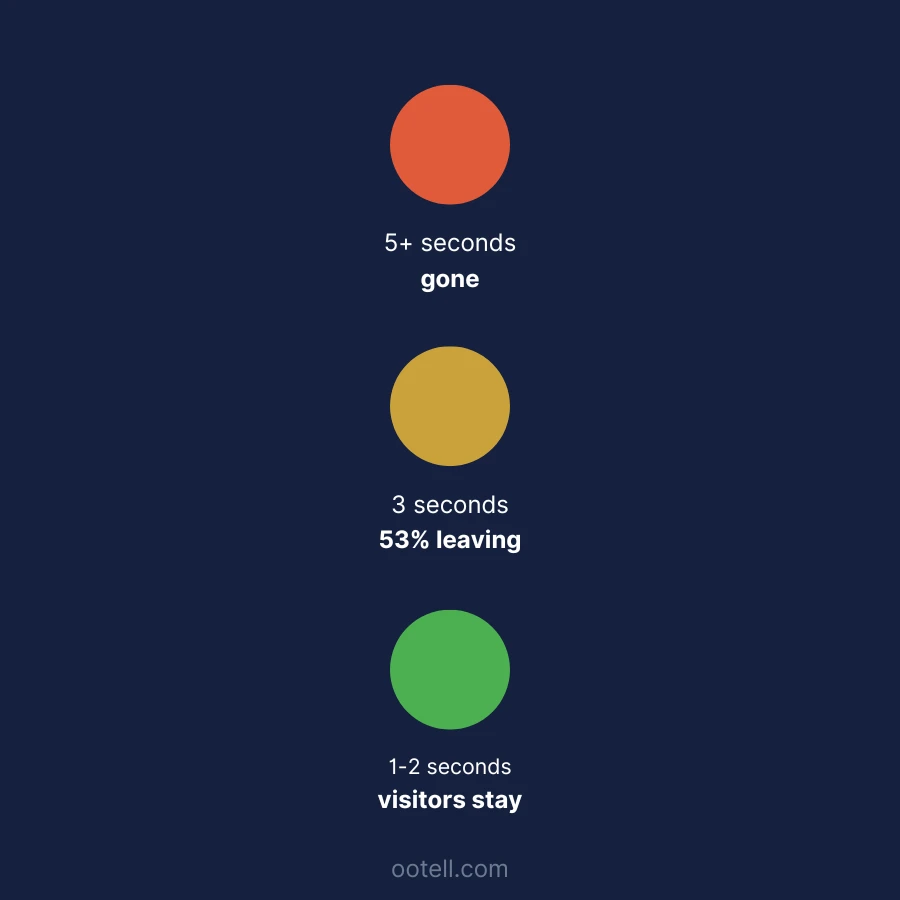
This is a common, quiet cause of a low conversion number. A site can look fine and still be losing a real share of visitors before they ever see the booking form, simply because it’s slow to load on the connection and device most guests are actually using.
Check your own numbers
You don’t need a full audit to get a first read on where you stand. If you have GA4 connected:
- Find your booking-engine conversion event - however your booking flow reports a completed reservation (a purchase event, a goal completion, or similar), pull the conversion rate for the date range you want to check.
- Split it by device category. Compare mobile against desktop. A gap of more than roughly 2x is worth treating as a priority, not a footnote.
- Split it by traffic source or channel if you can. A low overall number that’s actually fine on your highest-intent channels (direct, Google Hotel Ads) but poor on organic or social tells a different story than a number that’s low everywhere.
- Sanity-check page speed with a free tool like Google PageSpeed Insights on your actual booking flow pages, not just the homepage.
If you don’t have GA4 connected at all yet, that’s itself worth fixing before anything else on this list - you can’t improve what you can’t see.
What to do if you’re below benchmark
Where to go next depends on what the numbers above actually show:
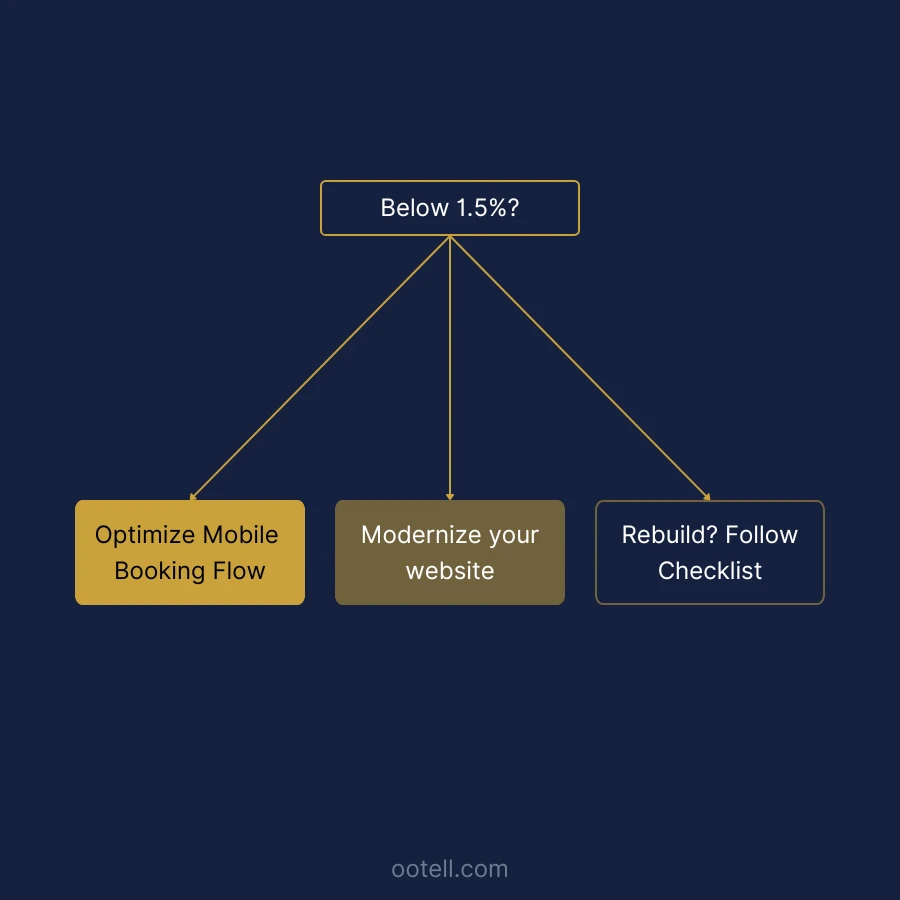
- If mobile is the clear gap, start with mobile booking best practices.
- If the whole site feels dated or the booking flow has obvious friction beyond just mobile, see signs your hotel website is losing bookings for a fuller diagnostic.
- If you’ve already concluded a rebuild is the right move, the redesign checklist covers what to scope for.
And if you’ve pulled your own numbers and want a second opinion on what’s actually holding them back, let’s talk - fifteen minutes, no obligation.
Build Greatness! 🍀
Michael
Frequently asked questions
- What is a good conversion rate for a hotel website?
- There isn't a verified, primary-sourced industry benchmark for this - I checked, including Cloudbeds' 90-million-booking 2026 report, which doesn't track this metric at all. The widely-repeated 1.5-3.9% range traces back to an uncited claim on Hotel Tech Report, so treat it as a rough sanity check, not a verified number. The most reliable comparison is your own site against its own history - see the 'Check your own numbers' section.
- Why is my hotel website's conversion rate so low?
- The most common causes are a mobile booking flow with friction, slow page load, no clear price-parity or direct-booking incentive, or traffic that's mostly low-intent (blog, organic search) rather than high-intent (direct, Google Hotel Ads). See signs your hotel website is losing bookings for a fuller diagnostic.
- How do I calculate my hotel website's conversion rate?
- In GA4, pull the conversion rate for your booking-engine completion event, then split it by device (mobile vs desktop) and by traffic source. See the "Check your own numbers" section above for the full walkthrough.
- Should I compare my website's conversion rate to Booking.com or Expedia?
- No. OTA conversion rates reflect a visitor who already searched, compared, and clicked into a specific listing, closer to a decision - I couldn't find a credible sourced percentage for this, but the direction is well established. Your own site carries more early-stage traffic, so a lower number by comparison is expected, not necessarily a problem.
- What's the fastest way to improve a low conversion rate?
- Start with whichever gap is largest in your own numbers: mobile UX (see mobile booking best practices), page speed, or a full redesign if the whole flow feels dated (see the redesign checklist).